Compound interest calculator with withdrawals
Use this compound interest calculator with withdrawals to see how fixed monthly spending changes your savings balance. It shows the first withdrawal that cannot be paid in full, the amount still available that month, and every monthly cash flow leading to it. An optional fixed monthly deposit can be included.
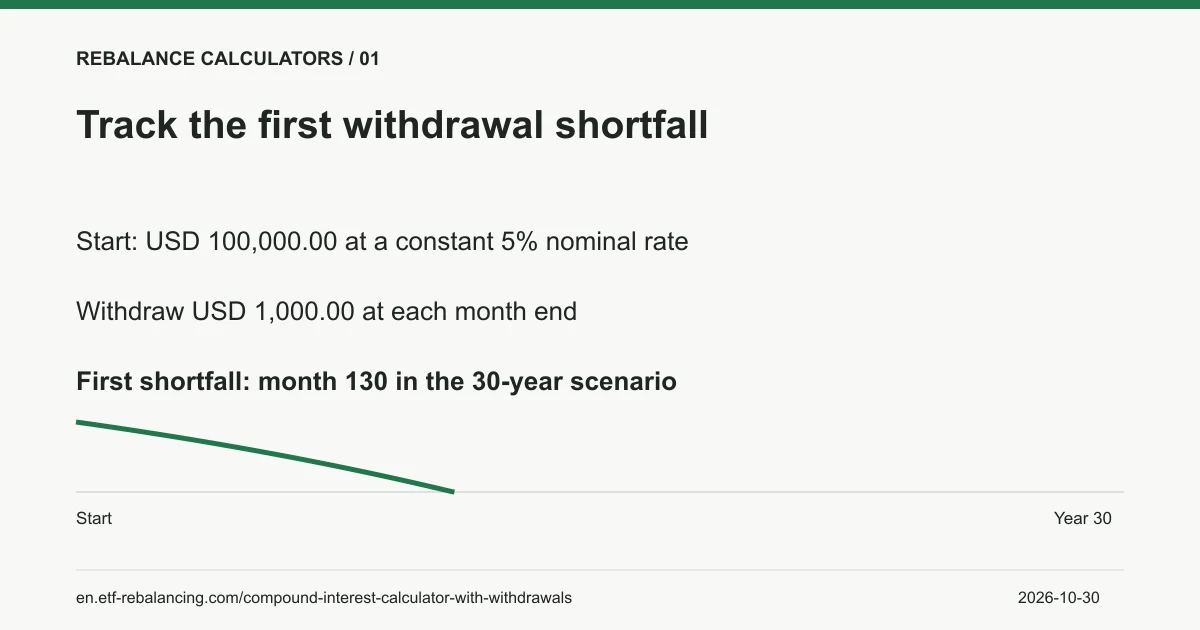
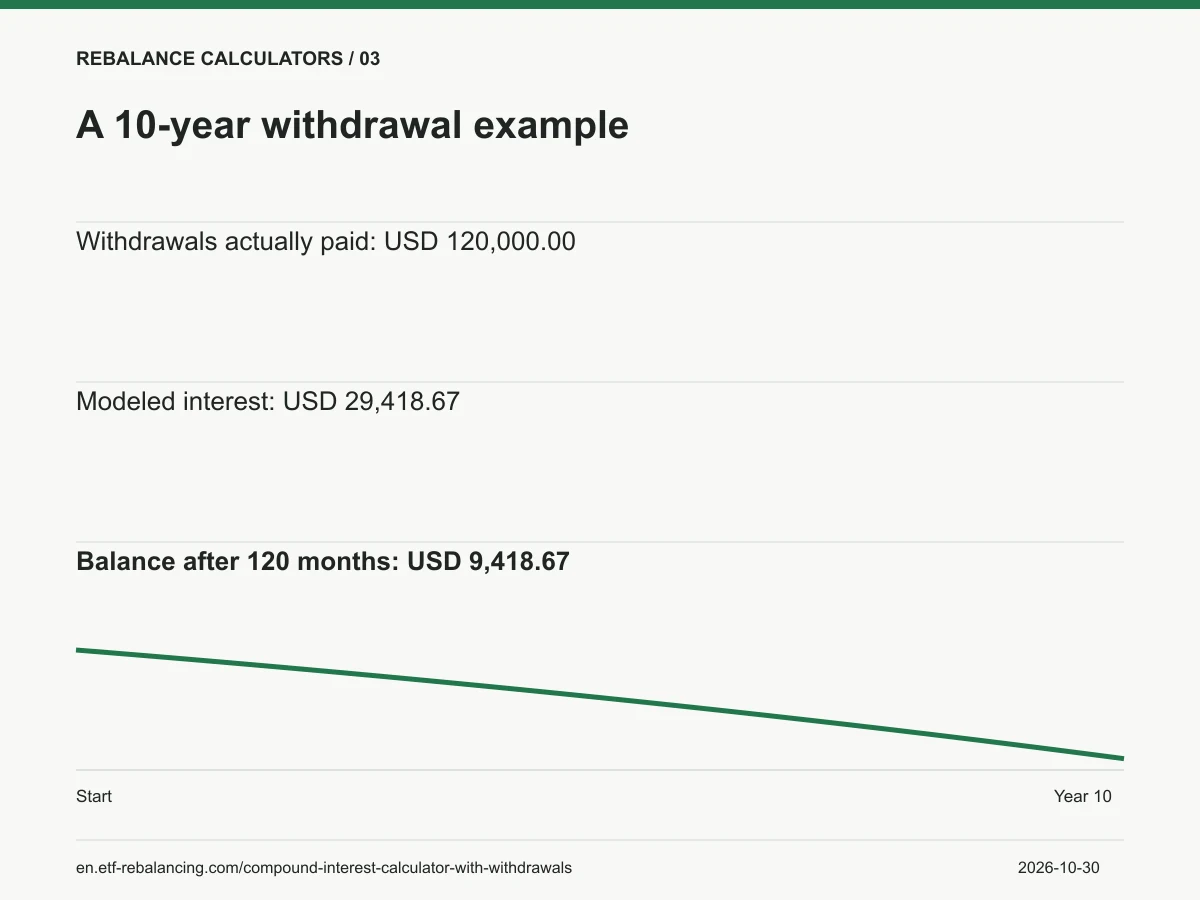
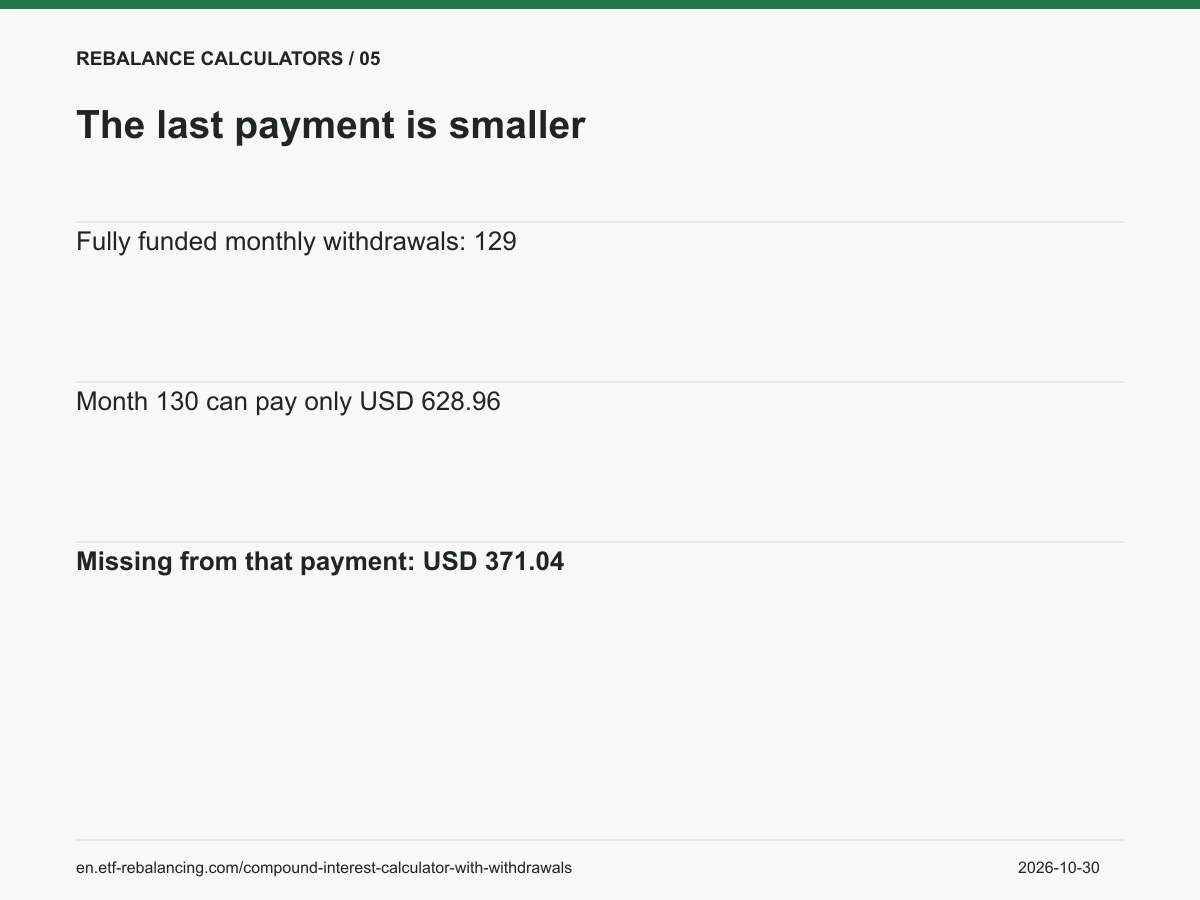
For example, start with USD 100,000.00, model a constant 5% nominal annual rate compounded monthly and withdraw USD 1,000.00 at each month end. After 10 years, USD 9,418.67 remains. If you request 30 years, the first payment shortfall occurs in month 130: the first 129 withdrawals are fully funded, then only USD 628.96 is available for the next payment.
How compound interest with monthly withdrawals is calculated
The model works one month at a time. With opening balance B, annual nominal rate R, deposit D and planned withdrawal W, the monthly rate is r = R / 1,200. Funds available at month end are A = B × (1 + r) + D. The actual withdrawal is the smaller of W and A; the closing balance is A minus that payment.
Interest is calculated before the deposit and withdrawal. Your deposit can help fund that month’s withdrawal, but it does not earn interest until the following month. The nominal annual rate is compounded monthly; it is not an APY. For example, 5% nominal is about 5.116% effective annual growth before cash flows.
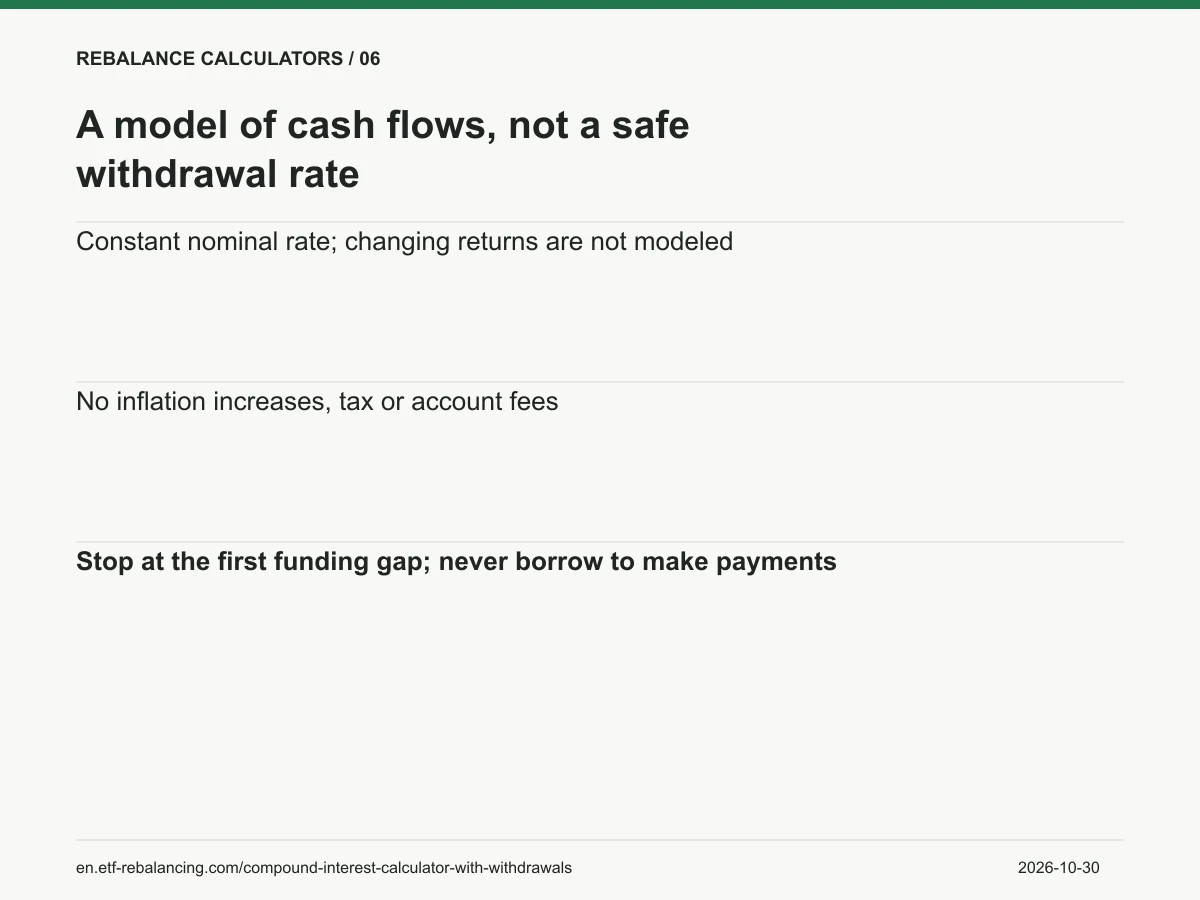
If available funds are less than the requested withdrawal, the tool pays only what is available and stops. It does not create a loan, allow a negative balance, or assume future deposits rescue a payment that has already failed. For a month fully paid with exactly zero left, a shortfall occurs only if a later scheduled payment cannot be funded.
A real calculator comparison, with the difference disclosed
On October 30, 2026, we entered 100,000 starting funds, 5% yearly nominal interest, monthly compounding and a 1,000 monthly withdrawal into The Calculator Site’s savings calculator. No deposits or inflation increases were selected. Its result states that contributions occur after interest at each period end.
| Check | Reference result | Our result |
|---|---|---|
| Balance after 10 years | $9,418.67 | USD 9,418.67 |
| Interest over those 10 years | $29,418.67 | USD 29,418.67 |
| First funding gap in a 30-year scenario | 10 years and 10 months until zero | Month 130; USD 628.96 paid, USD 371.04 missing |
The reference continues its long projection into negative balances after depletion. Our schedule stops at the first payment shortfall. Therefore the 30-year ending balances should not be compared as though both tools allow borrowing. Before depletion, we also verify the schedule with the independent equation Bₙ = P × (1 + r)ⁿ + (D − W) × ((1 + r)ⁿ − 1) / r, using the zero-rate limit when r = 0.
Read the withdrawal schedule before relying on the headline
A withdrawal is money paid out, not an investment loss. The reviewed 10-year example pays USD 120,000.00 in withdrawals and earns USD 29,418.67 in modeled interest, leaving USD 9,418.67 from the initial USD 100,000.00.
| Year | Withdrawn that year | Interest that year | Closing balance |
|---|---|---|---|
| 1 | USD 12,000.00 | USD 4,837.33 | USD 92,837.33 |
| 5 | USD 12,000.00 | USD 3,255.13 | USD 60,329.79 |
| 10 | USD 12,000.00 | USD 777.20 | USD 9,418.67 |
| 11 (partial) | USD 9,628.96 | USD 210.29 | USD 0.00 |
Year 11 includes only months 121–130, with a smaller final payment. It is not a complete year of withdrawals. The result page includes the full monthly table and the planned versus paid amount for the shortfall month.
Model your own monthly withdrawals
- Enter your starting funds and fixed monthly withdrawal. Choose the USD or CAD label.
- Set a whole-year duration and illustrative constant nominal annual rate. Add an optional monthly deposit only if it is part of your scenario.
- Choose View results. Read whether all requested payments are funded or a first shortfall occurs, then check the amount actually paid.
- Switch between annual and monthly schedules. Download a real Excel document containing all modeled months or a PDF with the assumptions and annual totals.
The address of the separate result page does not contain your amounts. Inputs stay in this tab and expire after 24 hours. Return to change inputs if you want to compare a smaller withdrawal, another rate or a different duration.
What “month 130” means
In the example, 129 complete monthly withdrawals can be paid: 10 years and 9 months of full payments. The next scheduled payment, at the end of month 130, can pay USD 628.96 instead of USD 1,000.00. The USD 371.04 gap is not silently counted as money withdrawn.
If every requested payment can be made within your selected duration, the headline says those payments are funded within that horizon. It does not claim the funds last forever, nor predict an exact later depletion date.
Assumptions and limits
- Returns stay constant every month. Investment volatility and the sequence of returns are excluded; those can materially change real withdrawal outcomes.
- Deposits and withdrawals are fixed nominal amounts. Inflation increases, tax, account fees and minimum distribution rules are not modeled.
- Zero withdrawals create a growth-only scenario. A zero balance alone does not trigger a funding gap when incoming deposits can pay the requested withdrawal.
- USD and CAD are labels only, with no currency conversion or country-specific tax treatment.
- Supported inputs are 1–50 whole years, rates from −50% to 50%, a starting balance up to 100 million, and monthly deposits or withdrawals up to 1 million. Oversized or unreliable projections fail clearly.
Common questions
How long will $100,000 last with $1,000 monthly withdrawals?
At 0% interest with no deposits, it makes 100 full payments, followed by a shortfall in month 101. At a constant 5% nominal annual rate compounded monthly with end-of-month withdrawals, it makes 129 full payments and a partial payment of USD 628.96 in month 130. These are fixed-assumption scenarios, not forecasts.
Can I add deposits while withdrawing?
Yes. Open Optional monthly deposit. Each deposit is added after interest and before the withdrawal. The schedule shows deposits and withdrawals separately, and stops at the first payment that cannot be fully funded.
Does this calculate a safe retirement withdrawal rate?
No. A constant rate cannot establish retirement sustainability. This tool shows cash flows under one fixed scenario, excluding variable returns, inflation, fees and tax. It does not recommend a withdrawal amount.
Can I change the withdrawal every year or use a percentage?
This version uses a fixed monthly amount, without annual increases or percentage withdrawals. Change the amount to compare another fixed scenario. The Excel export contains calculated values and does not recalculate as a formula template.
Sources and checks
- The Calculator Site savings calculator — actual 10-year and 30-year positive-withdrawal scenarios, nominal rate, monthly compounding and end-of-period convention.
- SEC Investor.gov compound interest calculator — a reference for nominal compounding and growth; our withdrawal-stop behavior is independently implemented rather than attributed to this source.
Published independently by Rebalance Calculators. See our verification standards for model checks and corrections. Reference checks do not imply official endorsement.