Compound interest calculator with monthly contributions
Compound growth depends on your starting balance, regular savings, rate and compounding frequency. This calculator separates money you put in from modeled interest or loss, and compares nearby constant-rate scenarios using the approach reviewed in Investor.gov’s tool.
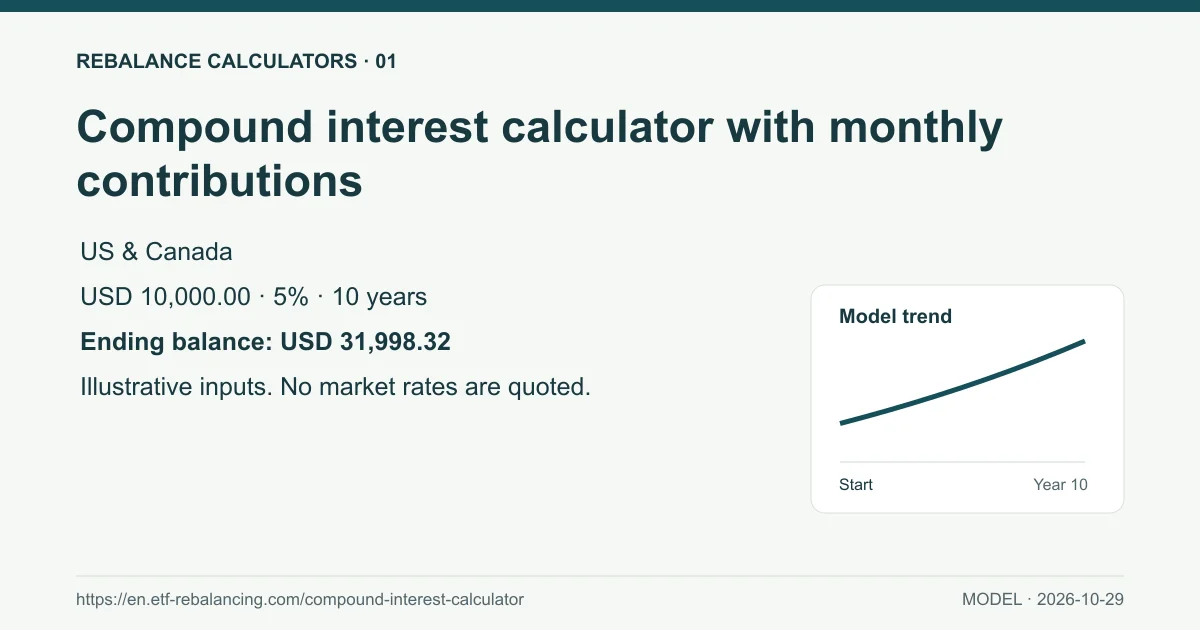
For example, USD 10,000.00 at 5% over 10 years with USD 100.00 contributed monthly produces an estimated USD 31,998.32 balance.
How the calculation works
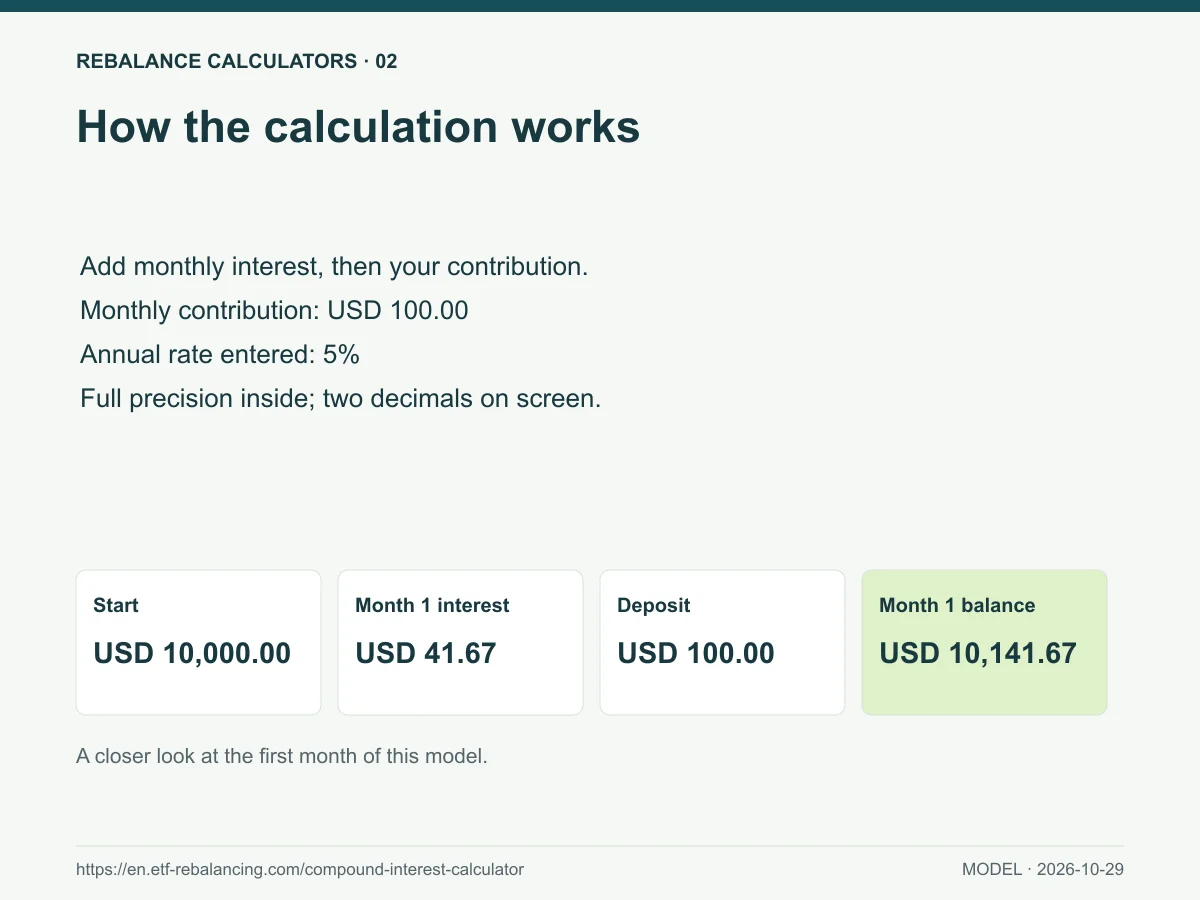
For f compounding periods per year, the period rate is the nominal annual percentage ÷ 100 ÷ f. Each period: new balance = previous balance × (1 + period rate) + monthly budget × 12 ÷ f. Deposits are added at period end. Monthly is the default. Annual compounding groups a monthly budget of 100 into 1,200 at each year end; daily compounding spreads the yearly budget over 365 equal periods. This is a budget-allocation model, not a reconstruction of actual calendar-dated bank transactions.
An example, year by year
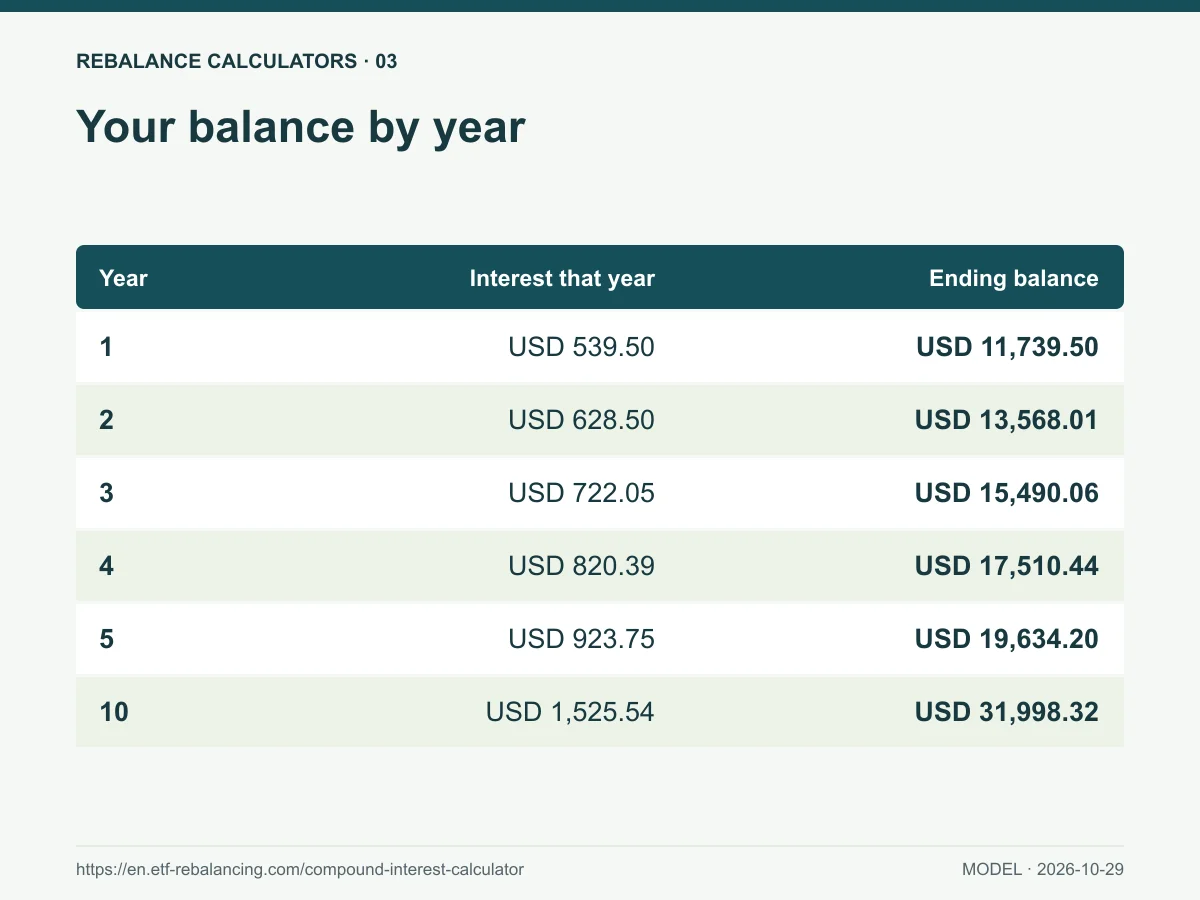
These are model outputs for the example above. They are not lender offers or a forecast of actual returns. Interest is shown for each individual year; ending balance is the balance at that year’s end.
| Year | Deposits | Interest | Ending balance |
|---|---|---|---|
| 1 | USD 1,200.00 | USD 539.50 | USD 11,739.50 |
| 2 | USD 1,200.00 | USD 628.50 | USD 13,568.01 |
| 5 | USD 1,200.00 | USD 923.75 | USD 19,634.20 |
| 10 | USD 1,200.00 | USD 1,525.54 | USD 31,998.32 |
From your values to a saved result
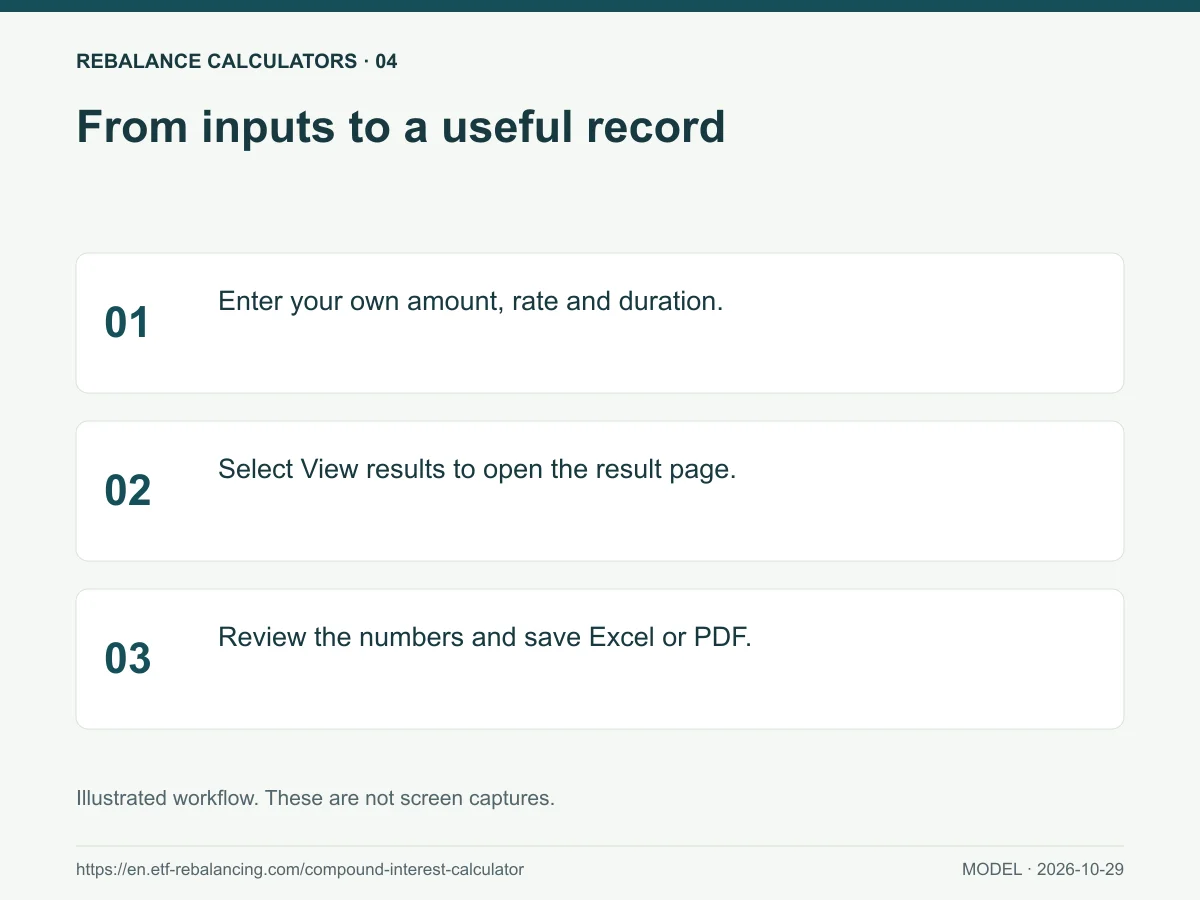
- Enter your own amounts and rate. Check the currency and duration before continuing.
- Choose View results to open your separate result page. You can return to change any value.
- Read the headline number alongside the assumptions and yearly table. Save every payment or compounding period in Excel or a yearly summary in PDF.
What the headline number means
Your ending balance includes both your own money and modeled interest. Contributions are not investment gains. Compare the two amounts before deciding whether a scenario fits your savings goal.
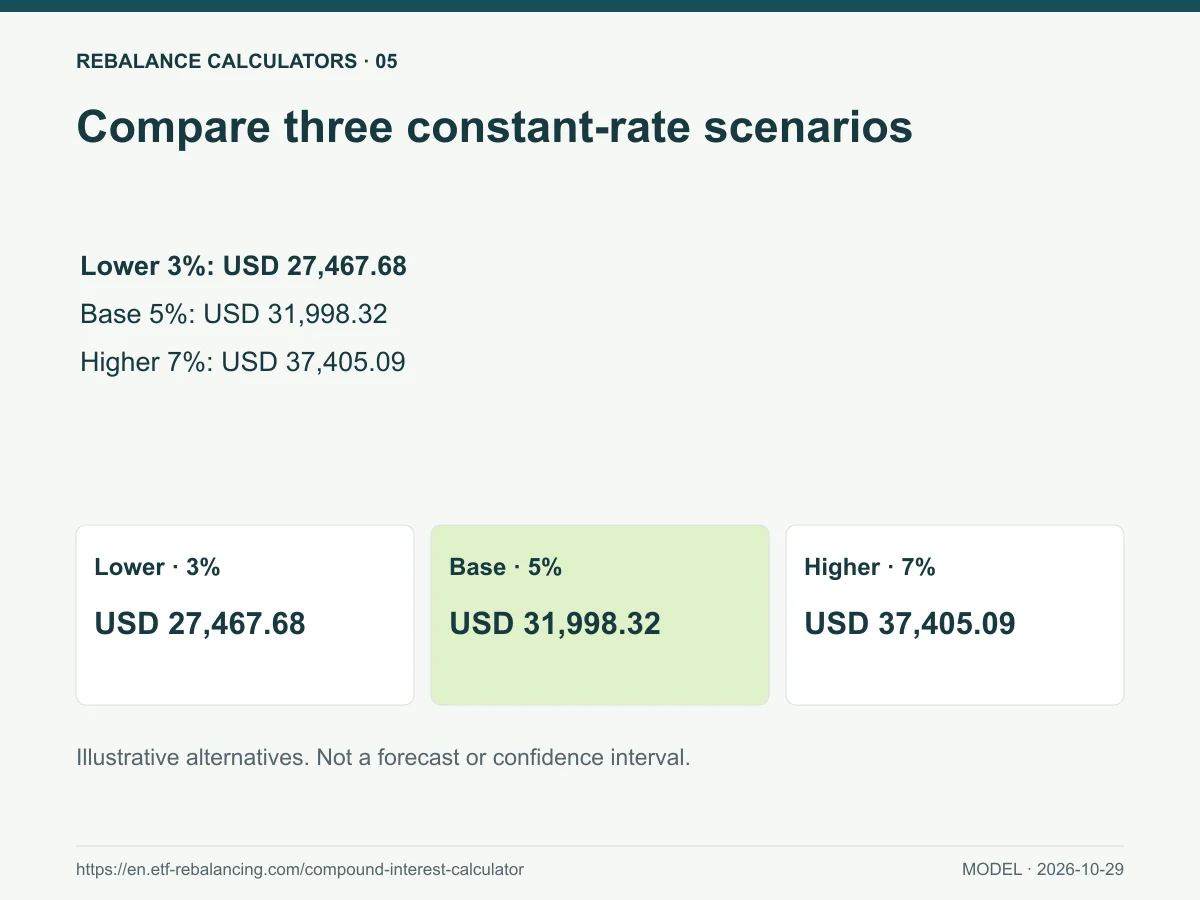
Check these assumptions
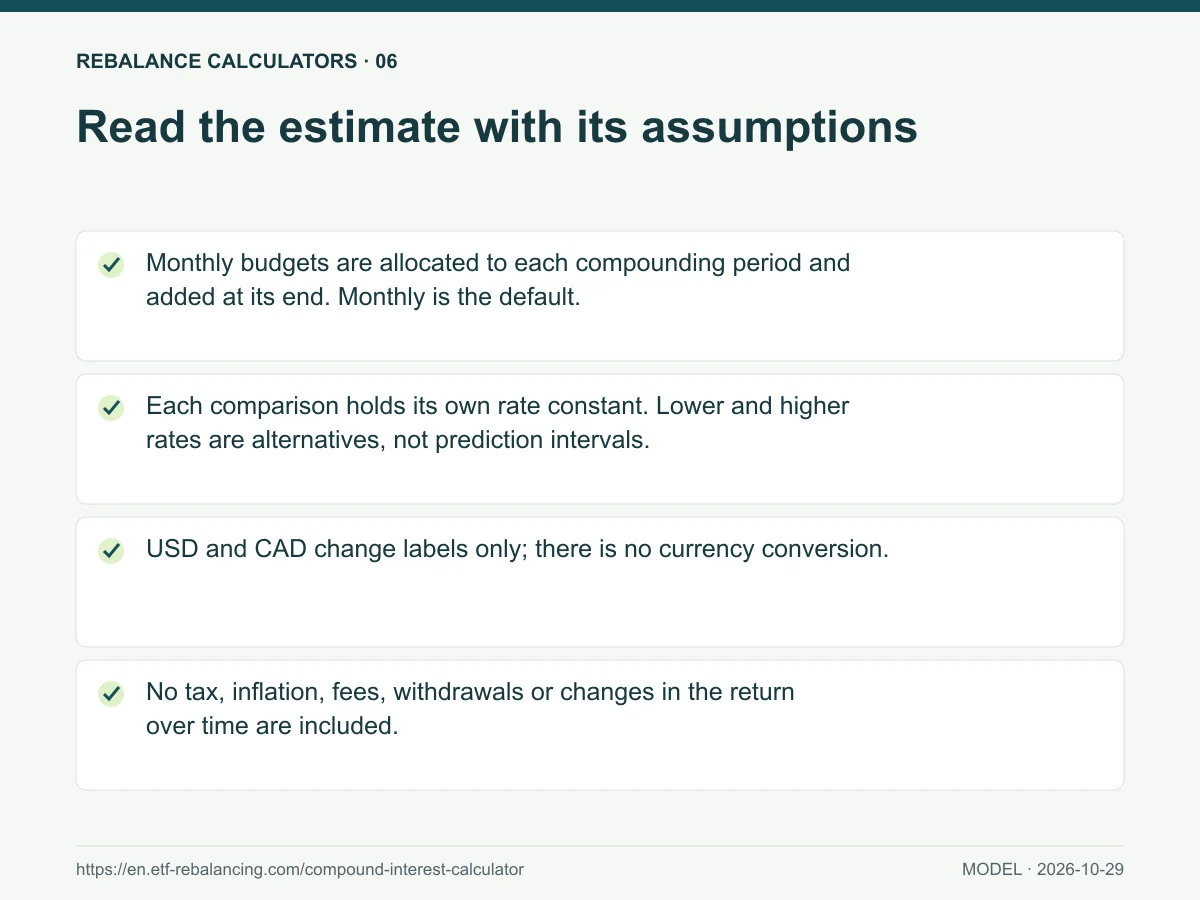
- Monthly budgets are allocated to each compounding period and added at its end. Monthly is the default.
- Each comparison holds its own rate constant. Lower and higher rates are alternatives, not prediction intervals.
- USD and CAD change labels only; there is no currency conversion.
- No tax, inflation, fees, withdrawals or changes in the return over time are included.
Common questions
When are contributions added?
At the end of each selected compounding period. With Monthly, your monthly budget is added after that month’s interest. Other frequencies allocate the annual budget across their periods, following the reviewed Investor.gov-style model. Choose Monthly when your intended deposits occur once each calendar month.
Can I use Canadian dollars?
Yes. Choose CAD to label all amounts in Canadian dollars. The calculator does not fetch an exchange rate or convert your USD amounts into CAD.
Is the annual rate an APY?
No. It is a nominal annual rate divided by the selected number of compounding periods. The equivalent annual growth is (1 + nominal rate ÷ periods) raised to that period count, minus 1. An account’s quoted APY is already an effective annual figure and should not be substituted as though it were nominal.
What happens at a zero interest rate?
Your ending balance is just your starting balance plus every monthly contribution. The calculator handles zero directly instead of dividing by the rate.
Can I view the schedule without downloading?
Yes. Results have an annual rate-comparison table and a paginated schedule for each compounding period. Excel includes every period, annual totals and the rate comparison. PDF contains a scenario summary, model assumptions and annual schedule.
Has it been checked against a well-known calculator?
The Investor.gov tool was used directly on October 29, 2026. Starting with 10,000, adding a monthly budget of 100 for 10 years at 5% produced 31,998.32 with monthly compounding, 31,382.42 annually and 32,054.60 daily. The 3% and 7% comparison cases were also checked. These are illustrative values, not offers or investment forecasts.
Can the modeled rate be negative?
Yes, from −50% to 50%. A negative constant rate shows a modeled loss; it is not labeled as positive earned interest. Contributions must remain non-negative, and this version does not model withdrawals.
Does this predict investment performance?
No. It shows the arithmetic of a constant-rate scenario. Real investment returns vary and can be negative; taxes and fees may also reduce growth.
Sources and benchmark checks
References checked October 29, 2026. Our calculator implements the stated model independently; it is not an official government tool.